During the boom, many VCs funded companies and created great exits within 12-24 months of funding. Before that time, the standard rule of thumb was that it took about 5-6 years for a company to reach maturity, profitability, and potentially become an IPO candidate. We did our own analysis of venture-backed software IPOs a couple of years ago (based on SEC filings, etc.) using pre-bubble data and this is what we found. Companies pre-1998 that went public received on average about $20mm of venture funding, were 6 years old, were EBITDA postive, and had a pre-IPO value of around $170mm (includes companies such as Peoplesoft, Intuit, Mercury, Documentum, Checkpoint, and Veritas). An interesting side note is that Veritas and Peoplesoft both went public in 1993 and were both acquired last week. This reminds me of a conversation I had this summer with a Veritas executive who said how difficult it was to scale beyond $1-2 billion in revenue and that size matters. There were a number of companies in that revenue band but very few above it like Microsoft, SAP, and Oracle. Getting back to the data on software IPOs, during 1998-1999, the companies that went public received around $30.0mm of VC funding, were 5 years old, were not EBITDA positive, and had an average IPO value around $375mm (includes comps like ISS, Micromuse, Art, Interwoven, Vignette, Informatica). The rule of thumb these days is that companies need to have around $50-60mm of revenue and be profitable for 1-2 quarters before going public. That is certainly a high bar and many companies will not get there.
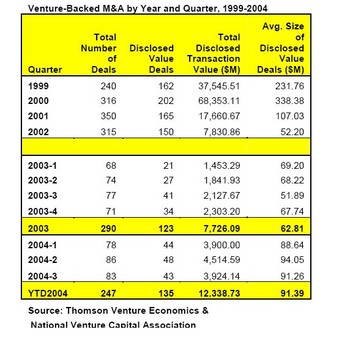
Another way of looking at company maturity is to look at M&A data. This week’s Plugged In column from Barrons has some great data on M&A in 2004 and how many of the companies that went public or were acquired were the very ones left for dead over the past few years. Of the 247 venture-backed companies which were acquired this year, 222 or 89.9% received its first venture funding prior to 2000 and 159 or 64.4% received its first round of funding between 1999 and 2000. Anyway, as I look at the data from Thomson Venture Economics and the NVCA, it is further proof that we are returning to normalcy in terms of the time it takes to build value.
 As you can see from the chart at the left, average valuations of M&A deals while trending upwards in 2004 to $91mm, is still way below the $231mm and $338mm numbers in 1999 and 2000. As we return to a state of normalcy, the point is that it takes time to build value and nothing happens overnight. In addition, I also see the definition of what makes a great exit changing. If we are returning to a pre-boom normalized valuation level where you need to make good money at exits of $50-100mm and a home run deal is around $250mm, it behooves us to make sure that we invest in capital-efficient business models to generate the same 8-10x that we once could with an average deal size of $300-400mm (see an earlier post for more on this topic).
3 comments on “It takes time to build value”
Comments are closed.